


What Is Power BI? A 2026 Guide
- Create and Learn

- 2 hours ago
- 5 min read
Quick answer
Power BI is Microsoft’s business intelligence and reporting platform. In simple terms, it helps you connect to data, prepare it, build a model, create calculations, design visual reports, and share dashboards online.
If Excel is where many people start with data, Power BI is often the next step when reports need to be repeated, refreshed, and shared.
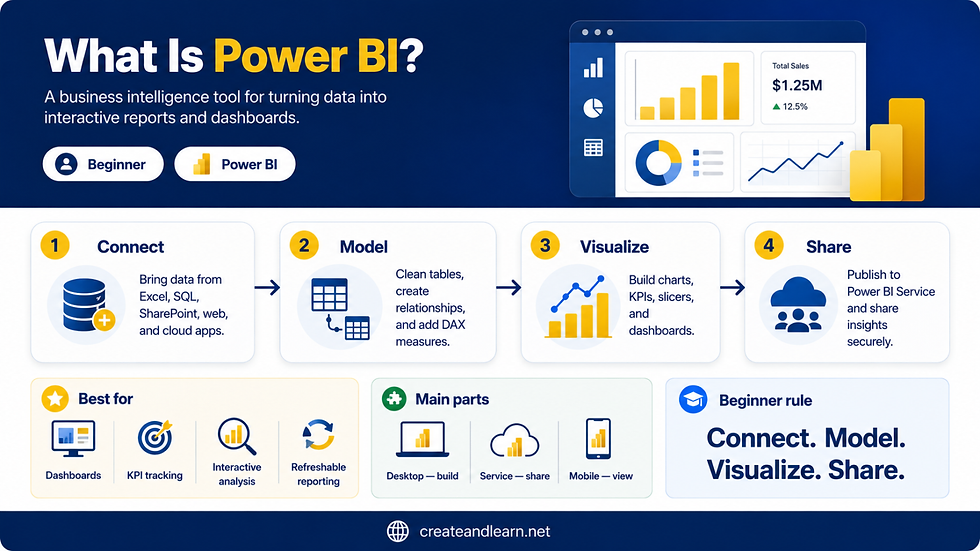
What is Power BI in 2026?
Power BI is a tool for turning raw data into useful visual reports.
Instead of sending people a spreadsheet with thousands of rows, you can build a report with KPI cards, charts, slicers, tables, maps, and pages that help them understand what is happening.
The important thing to understand is this: Power BI is not only a chart tool. The chart is the visible part. Behind a good Power BI report, there is usually data cleaning, a data model, calculations, and a clear business question.
In 2026, Power BI also sits inside the wider Microsoft Fabric world. Power BI is still the reporting tool many analysts know, but it is also connected to a broader Microsoft analytics platform for data engineering, storage, modeling, and reporting.

Power BI in one simple example
Imagine your manager asks every Monday:
Can you send me sales by region, product, and month?
In Excel, you might copy new data, refresh Pivot Tables, update charts, check formulas, save a new file, and email it again.
In Power BI, you can build the report once, connect it to the data, and refresh it when the data changes. The manager can open the report, filter by region, choose a month, click a product category, and explore the numbers without asking you for a new spreadsheet every time.
That is the simple idea: Power BI helps turn repeated reporting work into a reusable reporting system.
What does Power BI actually do?
A simple way to understand Power BI is to think of it as a reporting workflow.
Connect: bring in data from Excel, databases, folders, SharePoint, cloud services, and other sources.
Clean: use Power Query to remove messy rows, fix columns, combine files, and prepare the data.
Model: connect tables together so the report can answer business questions correctly.
Calculate: create measures such as total sales, profit margin, growth, ranking, and year-to-date results.
Visualize: build report pages with charts, cards, slicers, tables, and filters.
Share: publish the report so other people can view and interact with it online.
The beginner rule: Do not learn Power BI randomly. Follow the path: data → cleaning → model → measures → visuals → sharing.

A simple business example
Let’s say you work with sales data. The business wants to know:
Are sales growing or falling?
Which region is performing best?
Which products are driving revenue?
Which month had the biggest change?
How does this year compare with last year?
A spreadsheet can answer these questions, but it often becomes manual and fragile as the report grows. A Power BI report can answer them in one interactive place.
This is why Power BI is popular in finance, sales, HR, operations, marketing, and management reporting. It helps people move from “Can you send me the file?” to “Let’s open the report and understand what is happening.”
Power BI Desktop, Power BI Service, and Fabric
Beginners often get confused because “Power BI” can mean a few different things. The simple rule is:
Use Power BI Desktop to build reports. Use Power BI Service to publish, refresh, share, and manage them online.
Power BI Desktop
Power BI Desktop is the application you install on your computer. This is where many report creators connect to data, clean it, build models, create DAX measures, and design report pages.
Power BI Service
Power BI Service is the online environment. This is where reports can be published, organized into workspaces, shared with users, refreshed on a schedule, and managed securely.
Microsoft Fabric
Microsoft Fabric is the broader analytics platform around Power BI. If you are just starting, do not let Fabric scare you. Learn Power BI first. Later, Fabric becomes important as you move into larger data workflows such as Lakehouses, pipelines, warehouses, and enterprise analytics.
For Microsoft’s official explanation, see the Microsoft Learn overview of Power BI.

Is Power BI replacing Excel?
No. Power BI is not replacing Excel. They are different tools for different jobs.
Excel is excellent for flexible analysis, quick calculations, lists, templates, and one-off work. Power BI is stronger when the report needs to be repeated, refreshed, secured, and shared with other people.
If you are coming from Excel, think of it this way: Use Excel when you need flexibility. Use Power BI when you need a repeatable reporting system.
Many strong Power BI users are also strong Excel users. If you already understand tables, formulas, Pivot Tables, or Power Query in Excel, you already have a useful foundation.
What is Power BI best used for?
Power BI is best used when data needs to become a report that people use again and again.
Best for: dashboards, KPI reporting, monthly reports, executive reporting, sales analysis, finance reports, HR reports, and interactive business analysis.
Not best for: quick one-off calculations, highly flexible spreadsheet work, or small tasks where Excel is faster.
Beginner trap: thinking Power BI is only about visuals. The real skill is building reports where the numbers are trustworthy.
Is Power BI difficult to learn?
Power BI is easy to start, but it becomes deeper as your reports become more serious. Creating your first chart is not difficult. The harder part is learning how to clean data properly, create a good model, and write calculations that return the correct result.
The best learning order is:
Understand what Power BI is.
Install Power BI Desktop.
Import a simple dataset.
Clean data with Power Query.
Build relationships between tables.
Create simple DAX measures.
Design a clean report page.
Publish and share the report.
Want to build a complete Power BI dashboard?
This article gives you the big picture. The Power BI Business Intelligence Clinic book takes you through the full project path: cleaning data, building a model, writing DAX, designing report pages, and creating a complete dashboard from raw data.

FAQ
What is Power BI in simple words?
Power BI is a Microsoft tool that turns data into interactive reports and dashboards. It helps people understand business data through charts, filters, KPIs, slicers, and visual report pages.
Is Power BI free?
Power BI Desktop is free to download and use for building reports. Sharing, collaboration, and some online features in the Power BI Service may require a paid license, depending on how your organization uses Power BI.
Do I need to know Excel before learning Power BI?
No, but Excel helps. If you already understand tables, formulas, charts, Pivot Tables, or Power Query, Power BI will be easier to learn.
Should I learn Power Query or DAX first?
Most beginners should learn Power Query and basic data modeling before going deep into DAX. Clean data and a good model make DAX much easier.
Is Power BI still worth learning in 2026?
Yes. Power BI is still one of the most useful tools for analysts, Excel users, and business teams because it connects data preparation, reporting, dashboards, and Microsoft Fabric into one analytics ecosystem.


Comments