


Treemap + Concatenate function. Create and Learn.
- Create and Learn

- Jun 2, 2018
- 2 min read
Updated: Aug 16, 2018
Use the CONCATENATE function to improve your TREEMAP data labels.
TREEMAP is a hierarchical chart; it shows how the parts of hierarchy compare in size to each other.
CONCATENATE, one of the text functions, to join two or more text strings into one string.
Try this step-by-step to Create and Learn Excel.

For Excel 365
1- Type the information below in Range A1:C13.

2- Select Range A1:C13. Go to "Home" tab, "Borders" and "All borders.

3- Go to "Page Layout"' tab, "Sheet Options" and deselect Grid lines View.

4- Change the column B Width to 23.

5- Select cell B2. Go to "Home" tab, "Editing" group and select "More Functions".
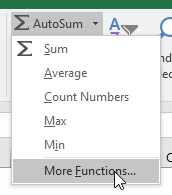
6- Type in the Search box or just search the function CONCATENATE.

7- Text1 type A2, Text2 type " - ", Text3 type TEXT(C2,"0%")
Text1 will bring the word: AdvertisingText2 will bring the information in quote and spaces: - Text3: Will bring the result of the TEXT formula to show the percentage number: 17%

8- You will save your time by using the “Auto Fill” feature. In cell B3 move your mouse to the little handle in the bottom-right corner, the mouse handle will turn into a black cross (see picture below).

9- Click and drag until B12 to use the “Auto Fill” feature

10- Select Range B2:C12

11- Go to "Insert" tab, "Charts" group, "Insert Hierarchy Charts" and select Treemap.

12- Select Chart, Go to "Chart Elements" and deselect "Chart Title" and "Legend".

13- Go to "Format" tab, "Size" group and set "Height" 9 cm and "Width" 16 cm.
14- Go to "Shape Outline" and select "No Outline".

15- Go to "Insert" tab, "Text" group and click on "Text Box".

16- Click and drag to create a text box then type Marketing Budget Allocation.

17- With the text box selected go to Go to "Shape Fill" and select "Gray-25%, background 2, Darker 75%" color. Change the text box configuration as figure below: Font Size 16, Font Color White and Center.


18- Go to "Format" tab, "Size" group and set "Width" 15.5 cm

19- Move the text box by clicking and dragging as figure below.

20- Select chart. Go to "Design" tab, "Change Colors" and select "Color 2".

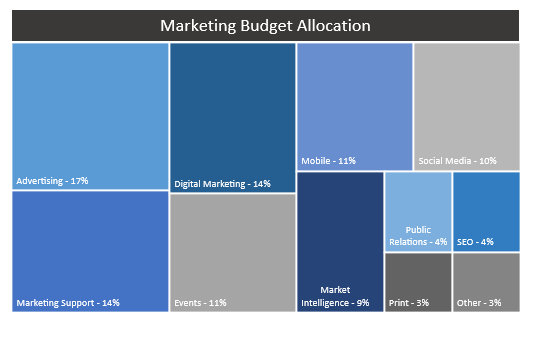
21- Save the image below (Marketing) by right clicking the image and select "Save image as".


22- Go to "Insert" tab, "Illustrations" group, click in "Picture" and choose the images that you just saved.

23- Go to "Format" tab, "Size" group and set "Height" 2.45 cm and "Width" 4.8 cm

24- Click and drag the image as figure below.
25- Congratulations! You have created a Treemap and have used the Concatenate function to customize your data label.
If you want to learn more about using charts and dashboard try my book "Dashboard using PivotTable".

http://a.co/1bVPIK2
If you like the post, please share:


Comments